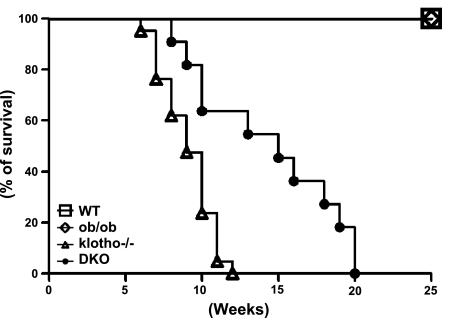
Figure 3.
Survival curve. Survival analysis of WT control (n=17), ob/ob (n=25), ob/ob-klotho−/− (n=11), and klotho−/− (n=21) mice. Note that the survival of hyperphosphatemic klotho−/− mice is much lower than for WT or ob/ob mice. All of the klotho−/− mice died by 13 wk of age, but none of the WT or ob/ob mice died within the 25 wk of the observation period. Notably, compared to klotho−/− mice, ob/ob-klotho−/− mice had slightly better survival and lived up to 20 wk of age.

