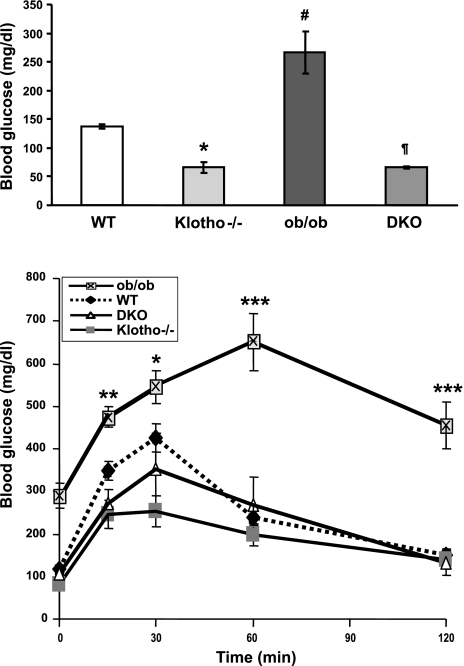
Figure 6.
Measurements of blood glucose and glucose tolerance test. Top panel: compared to WT mice (n=4; 136.8±3.47 mg/dl), fasting blood glucose levels are significantly increased in ob/ob mice (n=6; 266±36.29 mg/dl). In contrast to ob/ob mice, fasting blood glucose levels are dramatically reduced in ob/ob-klotho DKO mice (n=4; 65.8±2.32 mg/dl). Note that fasting blood glucose levels in klotho−/− mice (n=7; 66.0±10.05 mg/dl) are similar to those in DKO mice. *P < 0.01 vs. WT; #P < 0.001 vs. WT; ¶P < 0.001 vs. ob/ob. Bottom panel: blood glucose concentrations were measured at various time points before and after intraperitoneal administration of glucose. Compared to WT mice, blood glucose concentrations are significantly higher in ob/ob mice at 15 min following glucose challenge and remain higher throughout the following time points until 120 min, indicating a lack of blood glucose clearance in ob/ob mice. In contrast to ob/ob mice, blood glucose levels are significantly lower in both klotho−/− and ob/ob-klotho DKO mice after intraperitoneal glucose challenge, suggesting accelerated blood glucose clearance in mice without klotho activities. *P < 0.05, **P < 0.01, ***P<0.001 vs. WT.

