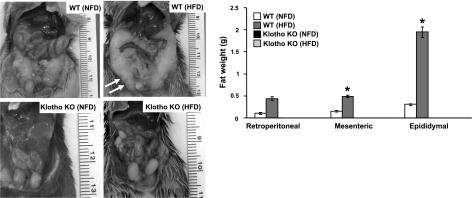
Figure 8.
Analysis of fat distribution in high-fat-diet-fed male mice. Left panel: gross phenotype of WT and klotho−/− mice fed the normal-fat diet (NFD) and high-fat diet (HFD) for ∼9 wk, showing abdominal fat accumulation (arrows) in WT mice fed HFD. Right panel: fat weight chart for WT and klotho−/− mice fed NFD and HFD. Analysis of retroperitoneal, mesenteric, and epididymal fat tissues suggest that WT mice fed HFD have increased accumulation of fat tissues, compared to their WT counterparts fed NFD. Note that no such fat accumulation is noted in HFD-fed klotho−/− mice. *P < 0.01 vs. WT (NFD).

