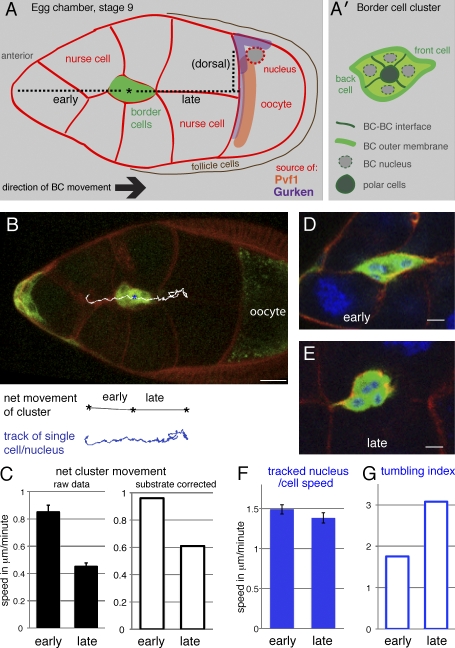
Figure 1.
Speed and directionality of border cell clusters during early and late phases of migration. (A) Schematic drawing of a stage 9 egg chamber corresponding to the image in B. Border cells (BCs) move posteriorly to the oocyte in all images shown as left to right. The attractive ligands are made by the oocyte: Pvf1 for PVR and Gurken, enriched dorsally near the oocyte nucleus, for EGFR. The dotted line corresponds to the early, late, and dorsal segments as indicated. (A’) Details of the border cell cluster. (B) Image from a wild-type video (UAS-CD8-GFP/+;slboGal4/+) showing the border cell cluster between early and late migration and the track of one nucleus (cell) over 2 h (white in overlay; blue below). All cells are outlined by FM 4–64 (red). Bar, 20 µm. (A and B) Asterisks indicate the midpoint of the posterior migration. (C) Net (point to point) speed of the border cell cluster center in micrometers per minute in early and late phase (n = 37 and 41). Error bars indicate SEM; the difference is significant (P < 10−9). The right graph shows the mean net speed corrected for mean backward sliding of the substrate. (D and E) Early migrating border cell cluster (D) and late cluster (E) expressing 10×GFP (green) stained with phalloidin (red) and DAPI (blue). Bars, 10 µm. (F) Speed of a single tracked nuclei (representing single cells) in a 2D projection; the difference is not statistically significant. (G) Tumbling index: path of a tracked single nucleus per cell over the net cluster path. (F and G) n = 17 and 18 cells.

