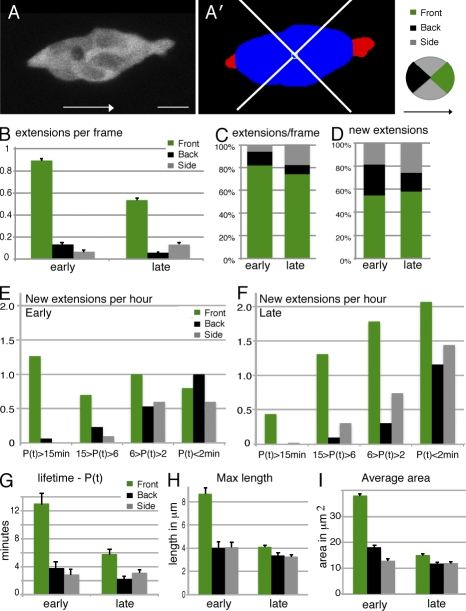
Figure 2.
Analysis of directional bias, persistence, and size of cellular extensions from normal border cell clusters. (A) Projected GFP image of a wild-type border cell cluster (slboGal4, UAS-10xGFP/+); arrows indicate direction to the oocyte. Bar, 10 µm. (A’) Same as A, but after segmentation and automatic definition of the cluster body (blue) and extensions (red). (B) Mean number of extensions observed per frame (snapshots) in each direction (n = 1,336 [early] and 2,350 [late] frames). All differences, including between early and late back and side extensions, are statistically significant (P < 0.001). (C) Data from B in percentages. (D) The percentage of distribution of new extensions in each direction (n = 207 [early] and 509 [late] extensions). (E and F) Early phase extensions (E) and late phase extensions (F) per hour of video, binned by direction and lifetime per persistence (P(t) in minutes). P(t) < 2 min are extensions observed in one frame only. (G) Mean extension lifetime, data as in E and F. Low P(t) means are not accurate because of the high contribution from a single-frame extension. (H) Maximal extension lengths. (E–H) n = 44–295. (I) Mean extension areas (in 2D projection) in micrometers squared, based on all snapshots (n = 88–1,064). All differences between front and other extensions are statistically significant; P < 0.01. Error bars indicate SEM.

