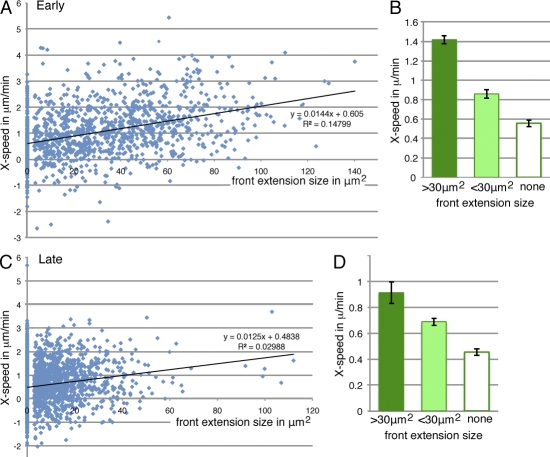
Figure 3.
Relationship between front extension size and forward movement. (A) Scatter plot of all early events (frames) according to an area in a 2D projection of the front extension and instantaneous movement (speed in micrometers per minute) of the cluster toward the oocyte to the next time point, measured in the x axis only. Dataset as in Fig. 2 B. (C) Scatter plot of all late events, as in A. Best-fit linear regression lines are shown. (B and D) Data from A and C, respectively, binned according to front extension size. None indicates no front extension above the technical cutoff of 3 µm2. SEM is indicated. All differences are significant (P < 0.001).

