Figure 4.
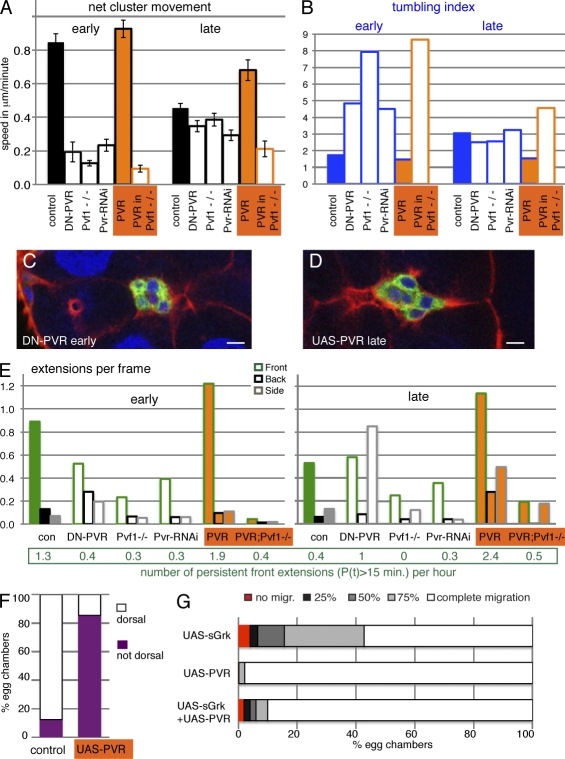
Effects of PVR on the behavior of border cell clusters. (A) Net movement of border cell clusters. Genotypes: slboGal4, UAS-10×GFP/+ (control [con]) and indicated UAS transgenes; Pvf1−/− is a Pvf11624 homozygous female, PVR in Pvf1−/− is slboGal4, UAS-PVR in a Pvf11624 mutant. SEM is indicated. All differences to control are significant (P < 0.02), except early PVR and late Pvf1−/−. n = 5–16. (B) Tumbling index (n = 3–12); genotypes as in A. (C) Early border cell cluster DN-PVR/+;slboGal4, UAS-10×GFP. (D) Late border cell cluster UAS-PVR/+;slboGal4, UAS-10×GFP/+. GFP marks border cells; phalloidin (red) marks F-actin, and DAPI (blue) marks nuclei. Bars, 10 µm. (E) Extensions per frame (n > 230 per genotype and stage). All values that appear modestly different are statistically significant (P < 0.02). The number of long-lived (P(t) > 15 min) front extension per hour is indicated below. These are rare, and most differences are not statistically significant. (F) Dorsal EGFR-dependent migration; slboGal4, UAS-10×GFP/+ (control) and UAS-PVR/+;slboGal4, UAS-10×GFP/+ (n = 78 and 100). (G) Position of border cells in stage 10 egg chambers. Genotypes: slboGal4, slbo1310-lacZ/+ and the indicated transgenes (n = 100–800). The control showed a 99% complete migration (migr.).

