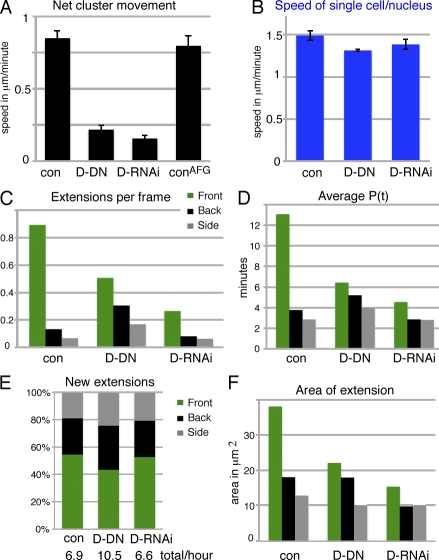
Figure 6.
Effects of perturbing both guidance receptors. (A) Net movement of border cell clusters. Genotypes (for all panels): slboGal4, UAS-10×GFP/+ (control [con]) or UAS-DN-EGFR/UAS-DN-PVR;slboGal4, UAS-10×GFP/+ (D-DN) or hsFLP/+;UAS-EgfrRNAi/+;UAS-PvrRNAi/AFG, UAS-10×GFP (D-RNAi) and hsFLP/+;AFG, UAS-10×GFP/+ (conAFG; n = 37, 38, 18, and 22, respectively). SEM is indicated. AFG (actin-flipout-Gal4) was activated 2 d before imaging to give expression in all somatic cells, including border cells. Only migration at stage 9, up to 50% of path (early), was analyzed. The controls looked similar in all regards. (B) Apparent single-cell speed (tracked nuclei). n = 12–17. (C) Extensions per frame (n > 1,300); all differences are significant with P < 0.001, except the side versus back of D-RNAi (P < 0.05). (D) Mean lifetime of extensions (P(t)); there were significant differences (P < 0.02) for front extensions in different genotypes and compared with side and back extensions. (E) Direction of new extensions in percentages; indicated below is the total number of extensions per hour (n > 200). (F) Mean extension areas in micrometers squared based on all snapshots of extensions; all differences are significant (P < 0.01), except for side extensions and control versus D-RNAi. (D and F) n = 150–266.

