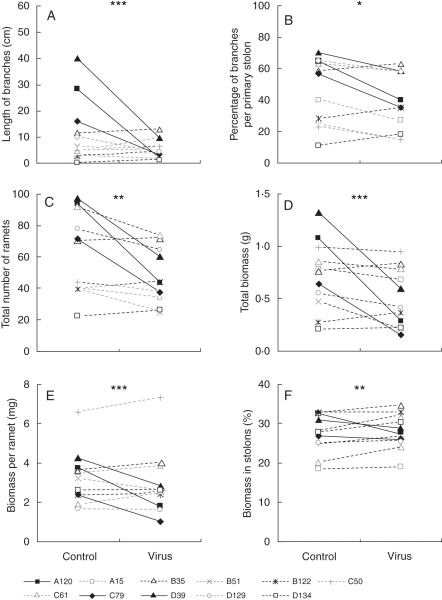
Fig. 1.
Genotypic variation in the effect of WClMV infection for (A) length of the branches, (B) percentage of branches on the primary stolon, (C) total number of ramets, (D) total biomass, (E) average biomass per ramet and (F) biomass allocation to the stolons, i.e. % biomass stolons. All traits show a significant genotype × virus interaction (two-way ANOVA: *P < 0·05, **P < 0·01 and ***P < 0·001), i.e. the genotypes are affected differently by the virus infection.

