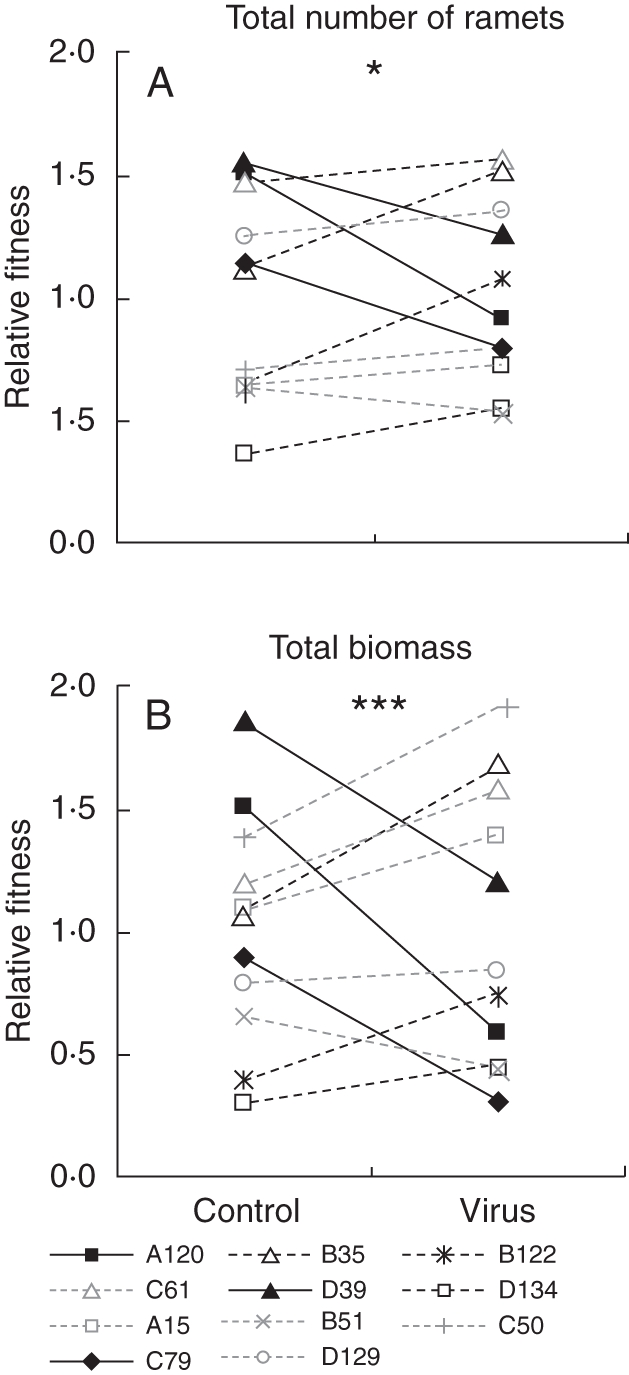
Fig. 2.

G × E interactions for relative fitness of the different genotypes, represented as reaction norm plots. The relative fitness of each genotype is calculated relative to the mean fitness within an environment (i.e. control or virus), where fitness is expressed by both the total number of ramets (A) and total biomass (B). The relative fitness of genotypes differs significantly between the virus-free and virus-prone environments (two-way ANOVA: *P < 0·05, **P < 0·01 and ***P < 0·001).
