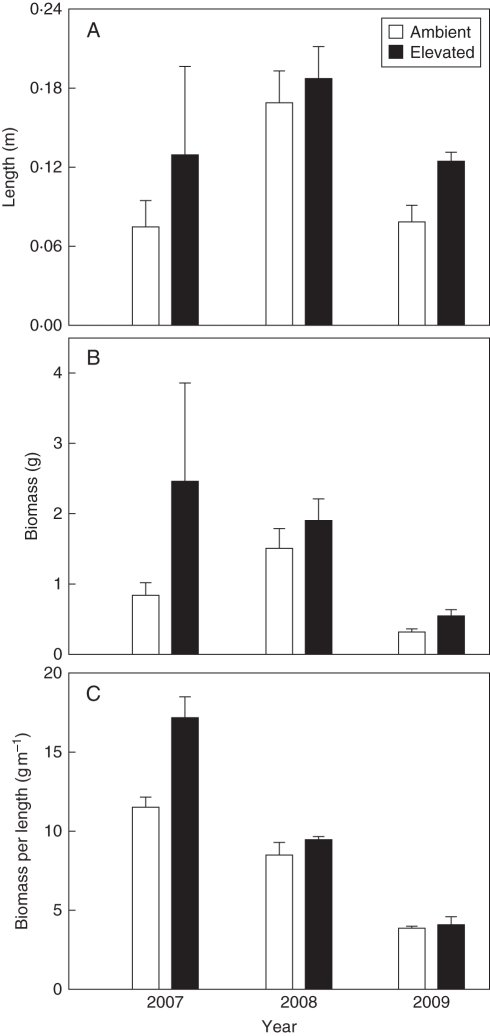
Fig. 3.
Comparison of (A) length, (B) dry mass and (C) dry mass per length of terminal shoots of Fagus sylvatica trees (means ± s.e.) exposed to ambient (n = 4) and elevated (n = 3) CO2 concentrations, as indicated. Masting occurred in 2007 and 2009, whereas 2008 was a non-masting year. The results of the statistical analyses are shown in Table 1.

