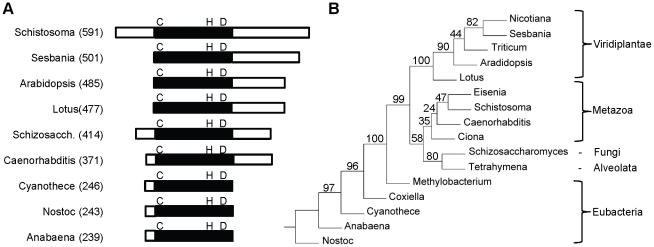
Figure 1. Genomic analysis of Schistosoma mansoni PCS.
(A) Diagram showing difference in length between the PCS proteins from different organisms: The extended N terminal regions and the C- terminal extensions are shown as open boxes. The conserved PCS domains are shown as a filled boxes and the catalytic triad of cysteine-histidine-aspartic acid is indicated in single letter code. The total number of amino acids for each protein is indicated in parentheses. (B) A phylogenic tree based on amino acid sequence of the phytochelatin domains of selected PCS proteins. The genera and accession numbers for the PCS proteins used in the analysis are indicated. The unrooted, neighbor-joining tree was constructed using PHYLIP (http://bioweb.pasteur.fr/phylogeny/intro-en.html) [63] and bootstrap values (100 resamplings) are shown. The PCS protein sequences are Nicotiana tabacum (AAO74500), Sesbania rostrata (AAY82881), Triticum aestivum (AAD50592), Arabidopsis thaliana (AAF428050), Lotus japonicus (AAT80341), Eisenia fetida (ABR13683), Schistosoma mansoni (XP_002569764), Caenorhabditis elegans (AAK62991), Ciona intestinalis (XP_002128372), Schizosaccharomyces pombe (NP_593552), Tetrahymena thermophila AAY68362), Methylobacterium nodulans (YP_002490343), Coxiella burnetii (ABS78257), Cyanothece sp. (EDX97627), Anabaena variabilis (ABA22569), and Nostoc punctiforme (ACC81212).

