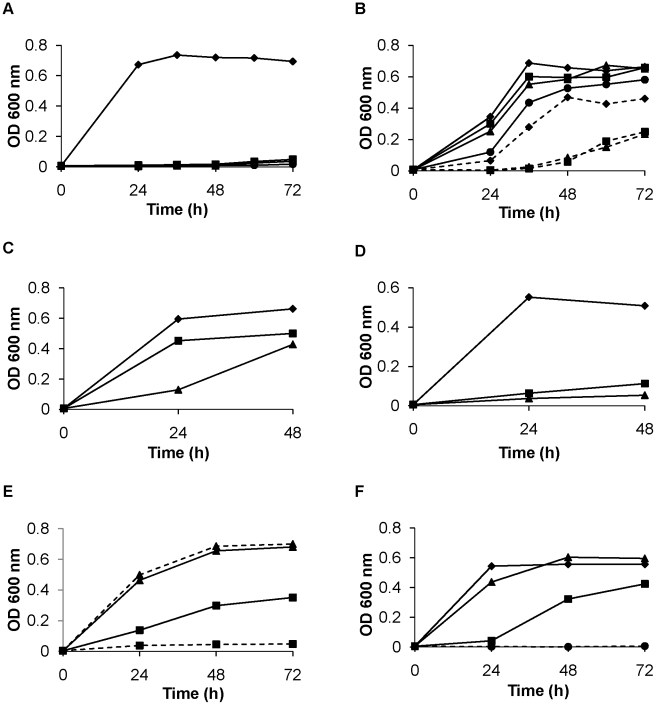
Figure 5. Functional characterization of Schistosoma mansoni PCS.
The growth of yeast, monitored by the increase in turbidity, transformed with the (A) empty vector (pYES) or the (B) mitochondrial variant of S. mansoni PCS in the presence of different concentrations (0–1000 µM) of cadmium chloride (0 µM, —♦—; 50 µM, —▪—; 100 µM, —▴—; 250 µM, —•—; 500 µM, ––♦––; 750 µM ––▪––; 1000 µM ––▴––). The growth of yeast transformed with the N-truncated variant of S. mansoni PCS (C) or the C-truncated variant of S. mansoni PCS (D) in 0 µM (♦), 250 µM (▪), or 500 µM (▴). (E) The growth of yeast transformed with the mitochondrial variant of S. mansoni PCS (PCS, solid lines) or the PCS variant with a partial PCS active site lacking the catalytic cysteine residue (PCS-P, dashed lines) in 0 µM (▴) or 500 µM (▪) cadmium chloride. (F) The growth of yeast transformed with the mitochondrial variant of S. mansoni PCS with no additions (♦), in the presence of 500 µM L-buthionine sulfoximine (BSO, ▴), an inhibitor of γ-glutamyl cysteine synthase, the first enzyme in the glutathione synthesis pathway, 500 µM cadmium chloride (▪), or both 500 µM BSO and 500 µM cadmium chloride (•). Yeast were cultured in SC minimal medium minus uracil plus 2% galactose at 30°C. The cell growth was monitored by spectroscopy at 600 nm.

