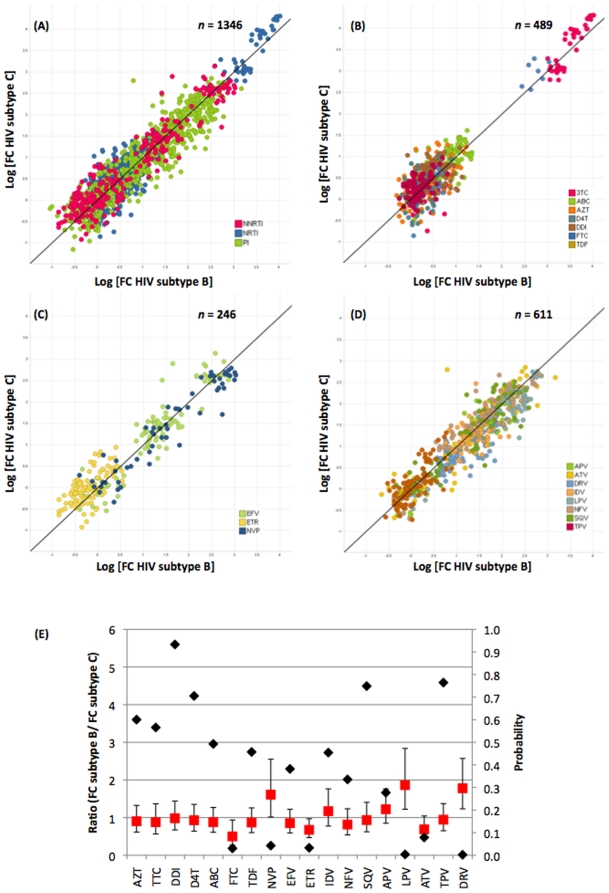
Figure 4. Scatter plots of FC of subtype C amplicons recombined in subtype B and subtype C backbones.
(A–D) X-axis: Subtype B and Y-axis: subtype C for 1346 pairs; Black line x = y; (A) all drug classes (R2 = 0.88); (B) NRTIs (R2 = 0.88); (C) NNRTIs (R2 = 0.90); (D) PIs (R2 = 0.87); (E) Analysis of the pair-wise comparison of differences in FCs per clone and per drug, Ratio FCSubtype B/FCSubtype C (Average, Red squares) and P-value (Black diamonds).

