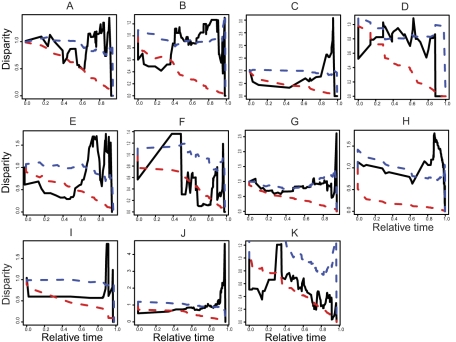
Figure 2. Disparity through time in extinction risk.
(A) Cypereae, (B) Disa, (C) Indiogofera, (D) Lachnaea, (E) Muraltia, (F) Pentaschistis, (G) Podalyrieae, (H) Restionaceae, (I) Zygophyllum, (J) Protea, and (K) Moraea. Solid line, observed values; dashed red line, Brownian expectations; dashed blue line, punctuated model (range asymmetry factor = 2, s.d. for evolutionary drift = 2, evolutionary trend = 0.3; Materials and Methods). Clade age is scaled between 0 and 1, with 0 zero representing clade origins and 1 representing the present day. High relative disparity towards the present (e.g., Cypereae, Indigofera, Muraltia, Podalyrieae, Protea, and Restionaceae) indicates that most variation in extinction risk is between species within subclades, i.e. closely related species frequently differ strongly in extinction risk. Low relative disparity towards the root of the tree (e.g., Disa, Indigofera, Moraea, and Muraltia) indicates that most variation in extinction risk is between subclades, i.e. species are more similar in extinction risk within subclades than between subclades.

