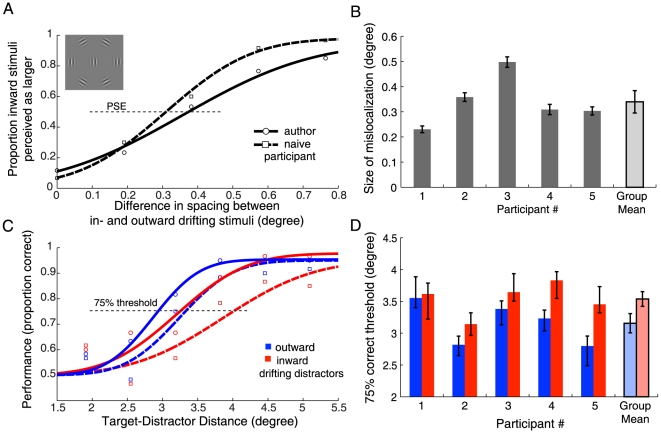
Figure 2. Results from Experiment 1.
A Raw data and psychometric function fits for one author (circles, solid line) and one naïve participant (squares, dashed line) from Experiment 1A. The x-axis denotes the difference in spacing between inward and outward drifting stimuli; positive values mean that spacing for inward was larger than for outward drift. The y-axis denotes the proportion of trials in which the spacing of inward drifting stimuli was perceived as larger than the spacing for outward drifting stimuli. Points of subjective equality (PSEs) are defined as the point where fitted functions cross 50% responses (thin dotted line). B PSEs from psychometric function fits (and bootstrapped 95%-confidence intervals [44]) for all five participants of Experiment 1A. The right-most bar shows the mean PSE of the group (and between-participant standard error of the mean). C Raw data and psychometric function fits from Experiment 1B for the same two participants as in A. The proportion of correct responses on the orientation discrimination of the target is plotted against the center-to-center target-distractor distance. Outward drift of distractors (away from the target) is shown in blue, inward drift (towards the target) in red. The red curves are shifted to the right relative to the blue curves, meaning that the distractors drifting towards the target had to be physically further from the target to achieve equivalent performance. D 75%-correct thresholds from psychometric function fits (and confidence intervals) for all participants in Experiment 1B. The rightmost bars show mean thresholds (and between-participant standard errors). Outward drifting distractors (blue) led to significantly lower thresholds than inward drifting distractors (red).

