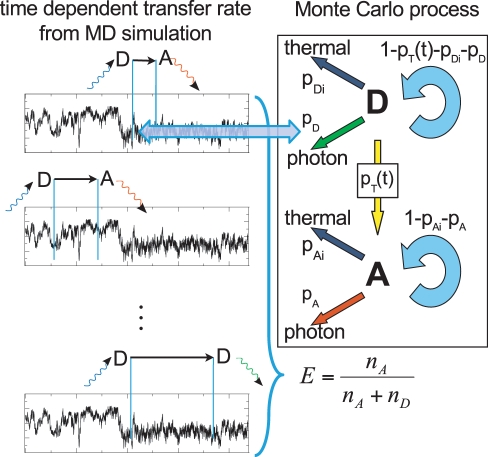
Figure 4. Photon generation by Monte Carlo.
FRET transfer rate coefficient vs. time, calculated from a molecular dynamics simulation (box, left part). A random starting point on the trajectory is chosen at which the donor dye is assumed to be excited by a photon (blue). Then, for each time step the MC process on the right side is evaluated according to the corresponding probabilities until de-excitation occurs. Four de-excitation pathways are considered, thermal de-excitation of donor or acceptor (dark-blue) and respective photon emissions (donor: green; acceptor: red). The ratio of the collected donor and acceptor photons is used to calculate a FRET transfer efficiency.

