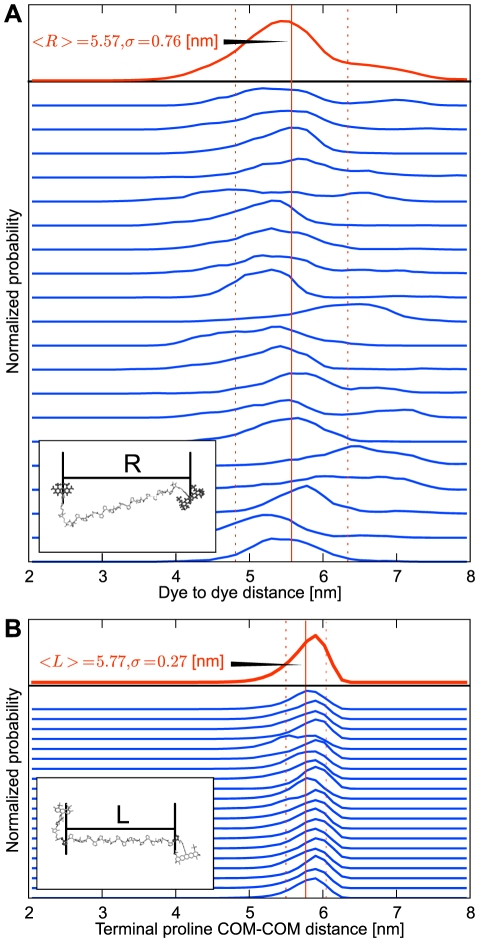
Figure 5. Distance distributions.
(A) Histograms of the distances between the geometric centers of the ring systems of the two dyes for 20 all-trans MD simulations. (B) The distance histogram between the COM of terminal prolines from the polyproline-20 chain, for the same simulations. The insets visualize the measured distance in each plot. Respective averages are shown in red; vertical lines denote the mean and standard deviation.

