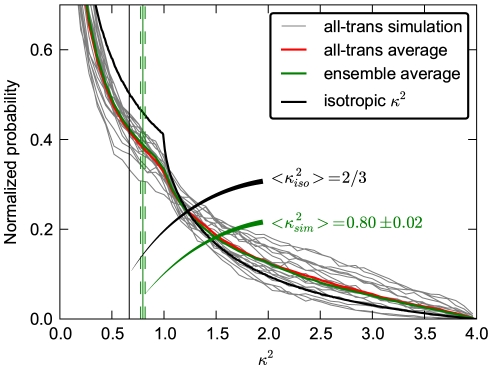
Figure 6. Distributions of the orientation factor  .
.
Each gray line shows to an orientation factor histogram from one of the 20 all-trans simulations at  , with the average shown in red. The green curve (full ensemble) additionally includes the cis-isomers with appropriate weights, the green vertical line shows the corresponding average and its statistical error (dashed). The black curve shows the
  histogram for an isotropic dye orientation distribution, with the well known mean value of
  (vertical black line).

