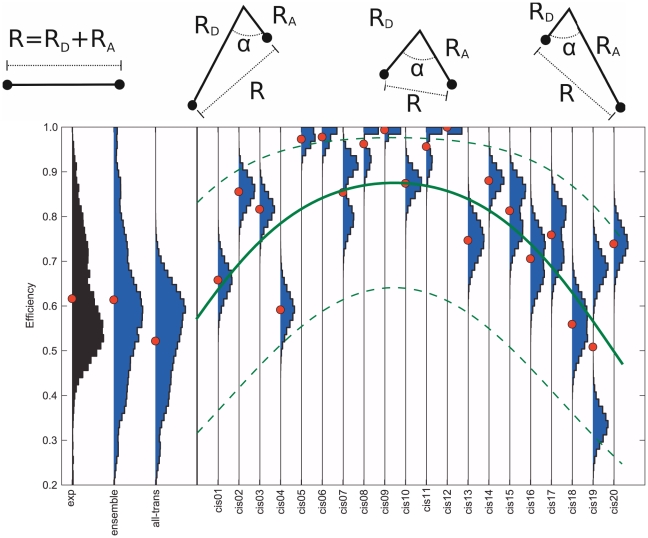
Figure 9. FRET efficiency of trans and cis isomers.
Comparison between measured FRET efficiency histograms (black) and histograms computed from the simulations (blue: ensemble, all-trans and cis01 ... cis20). Red dots denote the respective mean values. The simple model sketched on top and defined in the text describes the general trend (green line) that isomers with a cis-bond close to the termini show lower efficiencies, whereas those with cis-bonds close to the polymer center tend to yield higher efficiencies. The dashed green lines estimate the spread of the average efficiencies of the cis simulations mirroring the spread found for the all-trans simulations ( ). For illustration purposes, the photons of the individual cis were not discarded when generated below
  as described in the Methods Section. The high efficiencies observed for cis-6 to cis-12 result from dyes in contact and are quenched in the experiment.

