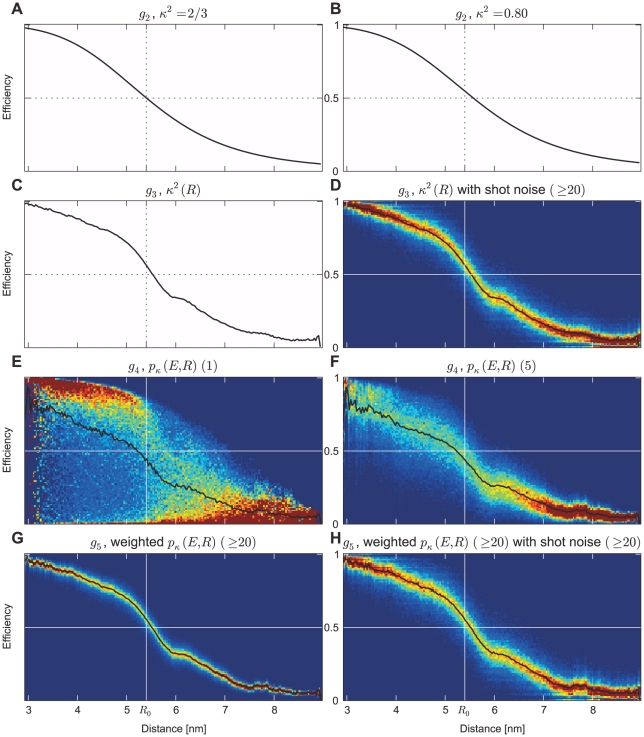
Figure 12. Transfer functions  at increasingly refined approximation levels.
Transfer functions A, B, and C are shown as black curves; the remaining transfer functions are shown color-coded, with averages highlighted as black curves. Transfer function  was calculated using the assumption of
  (A). For
  ,
,  was adjusted to represent the ensemble average in the simulations (B).
  includes the distance dependency of
  without (C) and with (D) shot noise derived from the experimental BSD (burst size or lower burst size cutoff given in brackets). In contrast to a distance dependent averaged
  ,
,  includes the
  distributions at each distance without (E) and including averaging within a burst (F). In
  , the time dependent photon emission (Fig. 14) is included, shown without (G) and with experimental shot noise (H).

