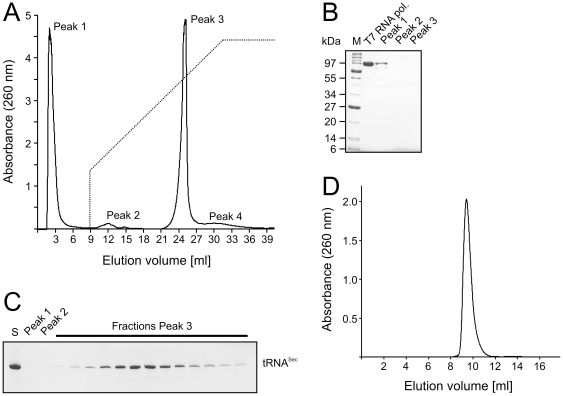
Figure 1. Non-denaturing RNA purification.
(A) Elution profile of in vitro transcribed mouse tRNASec from a MonoQ column. Peak 1 – unincorporated rNTPs, T7 RNA polymerase and other proteins; Peak 2 – abortive synthesis transcripts; Peak 3 – desired RNA sample; Peak 4 – aggregates or higher molecular weight nucleic acids. The gradient (buffer B from 30 to 100%) is shown as a dashed line. (B) Denaturing SDS PAGE analysis of peak fractions from Peaks 1–3. T7 RNA polymerase and molecular weight markers (M) were loaded as references. Protein bands were stained with Coomassie. (C) Denaturing urea PAGE analysis of peak fractions eluted from the MonoQ column. S – crude transcription extract. RNA bands were stained with methylene blue. (D) Elution profile of mouse tRNASec from a Superdex 75 10/300 GL column.

