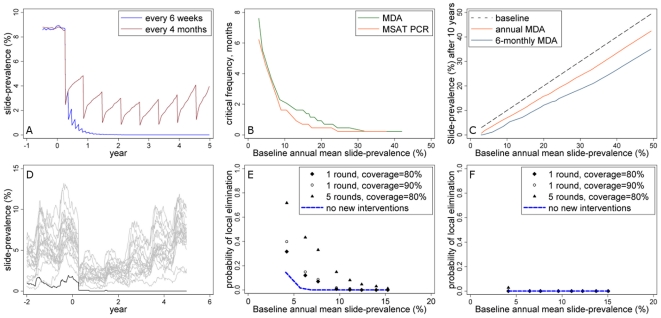
Figure 3. Potential for elimination by mass treatment.
(A) Example simulation of a mass treatment programme in a non-seasonal scenario where multiple rounds of MDA are carried out, and the interval in between treatment rounds is less (every 4 months) or more (every 6 weeks) than the critical interval required to achieve <0.1% slide prevalence. (B) Model-estimated minimum frequency of mass treatment required in a large population to bring slide-prevalence to 0.1% or less for at least 50 consecutive days in non-seasonal settings: MDA versus MSAT with PCR as a screening tool. (C) Model-estimated annual mean slide-prevalence after 10 years of MDA repeated every year or every 6 months, according to baseline slide-prevalence prior to intervention. Moderate seasonality is assumed (see Figure 2A). D) example stochastic simulations of transmission over time assuming a small human population (n = 1000) with 1 round of MDA before the peak transmission season in year 1. A single simulation in which MDA succeeds in eliminating infection locally is shown in black. E) and F) Model-estimated probability of local elimination at different transmission intensities in a population of (E) 1000 or (F) 10,000, following MDA of different intensities. Results are based on 500 stochastic realizations per plotted point. Moderate seasonality is assumed (see Figure 2A). All simulations in this figure assume a low level of vector control at baseline which is maintained over time (the baseline slide-prevalence shown is in the presence of vector control).

