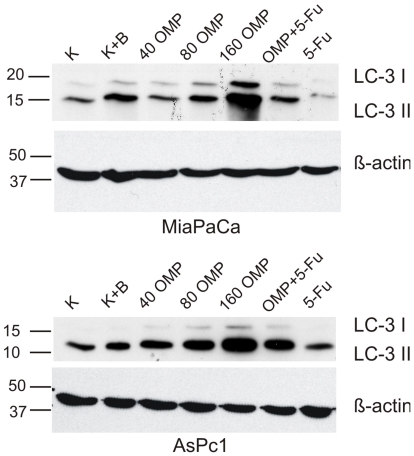
Figure 9. Western Blot analysis with LC3B-antibody in ASPC-1 and MiaPaCa-2 cells.
The experiment was repeated three times with nearly identical results. The LC3-I fractions can be clearly distinguished above the LC3-II signals. Bafilomycin A1 elevated slightly the LC3-II signal intensity compared to control in both cell lines. There was a marked and dose-dependent increase of the signal strength of both fractions when OMP was used. 5-FU alone did not relevantly influence the LC3-level. The corresponding β-Actin level is shown below the LC3-WB to confirm the correctness of this semiquantitative evaluation.

