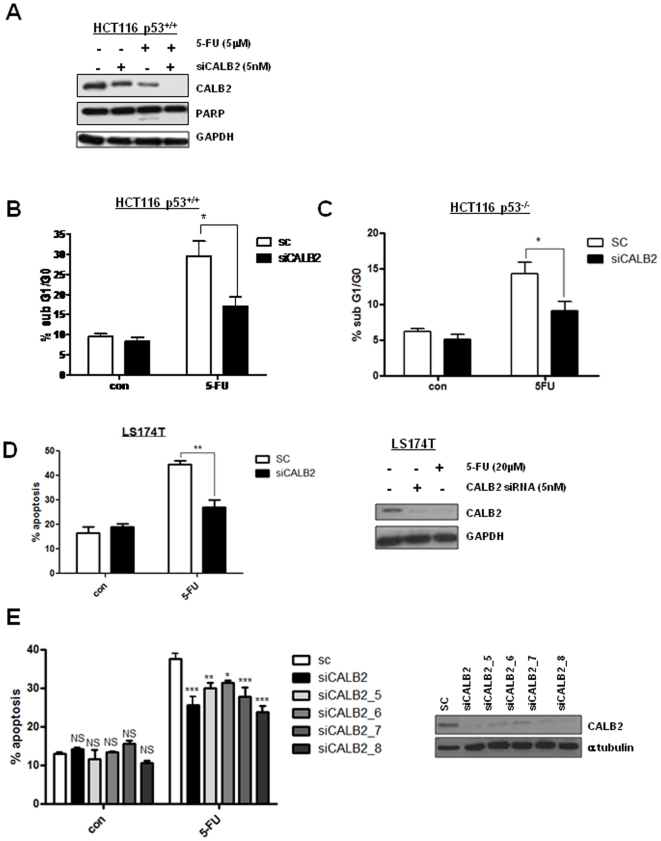
Figure 3. CALB2 silencing confers 5-FU resistance in CRC cell lines.
(A) Western blot analysis of CALB2 and PARP in the p53+/+ HCT116 cell line following transfection with control siRNA (−) or CALB2-targeting siRNA (+) and 72 h co-treatment with ∼IC60(72 h) dose of 5-FU. GAPDH was used as a loading control. Propidium Iodide flow cytometric analysis showing the percentage of cell population in sub-G1/G0 for (B) p53+/+ and (C) p53−/− HCT116 cells following transfection with control siRNA (SC) or CALB2 targeting siRNA (siCALB2) and 72 h co-treatment with 5 µM 5-FU. (D) Annexin V/propidium iodide flow cytometric analysis of the LS174T CRC cell line following transfection with control siRNA (SC) or CALB2 targeting siRNA (siCALB2) and 72 h co-treatment with ∼IC60(72 h) dose of 5-FU (20 µM). ** p<0.01, error bars represent mean ± SEM. (Inset) Western blot analysis of CALB2 expression in LS174T. GAPDH was used as a loading control. (E) p53+/+ HCT116 cells following transfection with control siRNA (SC), CALB2 targeting siRNA (siCALB2) or additional CALB2-targeting siRNA sequences (siCALB2_5, siCALB2_6, siCALB2_7 and siCALB2_8) and 72 h co-treatment with 5 µM 5-FU. (Inset) Western blot analysis of CALB2 expression following 72 h transfection with control siRNA (SC) or CALB2 targeting siRNAs in p53+/+ HCT116 cells. α-tubulin was used as a loading control.

