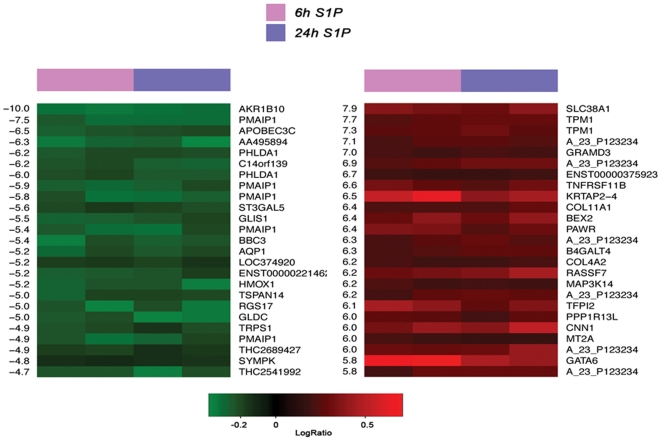
Figure 1. cDNA microarray analysis.
The heat map shows the top 25 down-regulated (left, green) and top 25 up-regulated (right, red) genes. On the left and right side d-values and gene names are reported respectively. Columns 1–2 represent S1P stimulation for 6 h and columns 3–4 represent S1P stimulation for 24 h.

