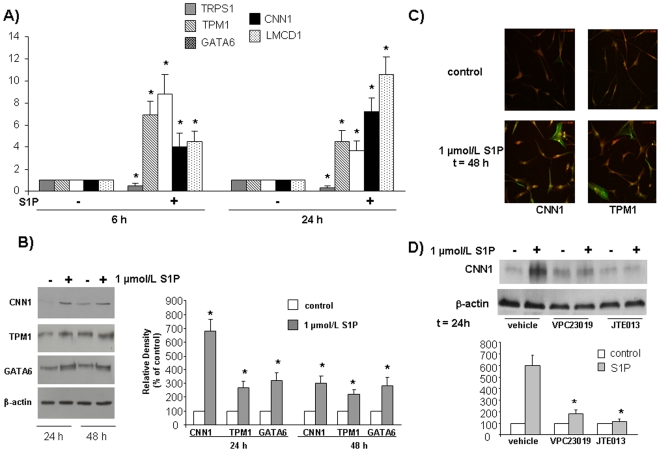
Figure 2. Effect of S1P on mRNA (A) and protein (B,C) expression levels of SM markers in human mesoangioblasts.
Role of S1PR (D). Cells were incubated in DMEM with S1P and analyzed by A) Real-Time PCR; B) Western blot analysis; (lower panel represents densitometric quantification) and C) Confocal microscopy analysis (40× magnification) using TRITC-phalloidin and anti-fluorescein conjugated specific antibodies. D) Cells were pre-incubated with VPC23017 and JTE071 in DMEM before being challenged with S1P and analyzed by Western blot analysis for CNN1 (lower panel represents densitometric quantification).

