Figure 3.

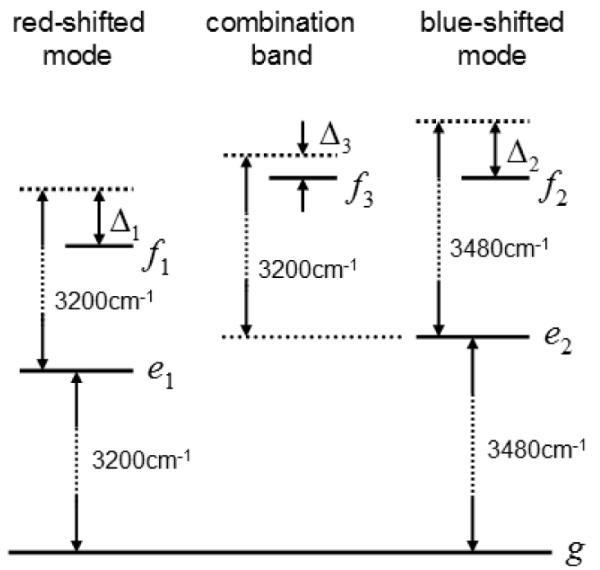
Energy level scheme for water OH stretch at the DMPC interface. State g, e, and f represent the ground, one-exciton, and two-exciton states. Δ1, Δ2, and Δ3 denote the frequency shifts of the two exciton states.

Energy level scheme for water OH stretch at the DMPC interface. State g, e, and f represent the ground, one-exciton, and two-exciton states. Δ1, Δ2, and Δ3 denote the frequency shifts of the two exciton states.