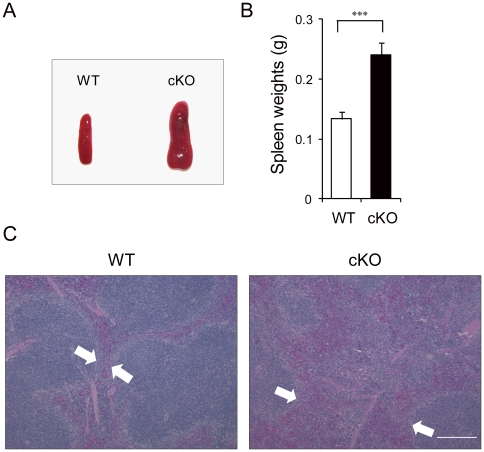
Figure 5. Increase extramedullary hematopoiesis in the spleen of Grp94 KO mice.
A) Representative spleen size and morphology of WT and cKO mice. B) Average spleen weights of WT (n = 19) and cKO (n = 25) mice. The data are presented as mean ± s.e., ***p<0.001. C) Representative H&E staining of paraffin sections of spleen from WT and cKO mice. Hematopoietic cells in the red pulp are indicated by the area between the two arrows. Scale bar represents 2 mm.

