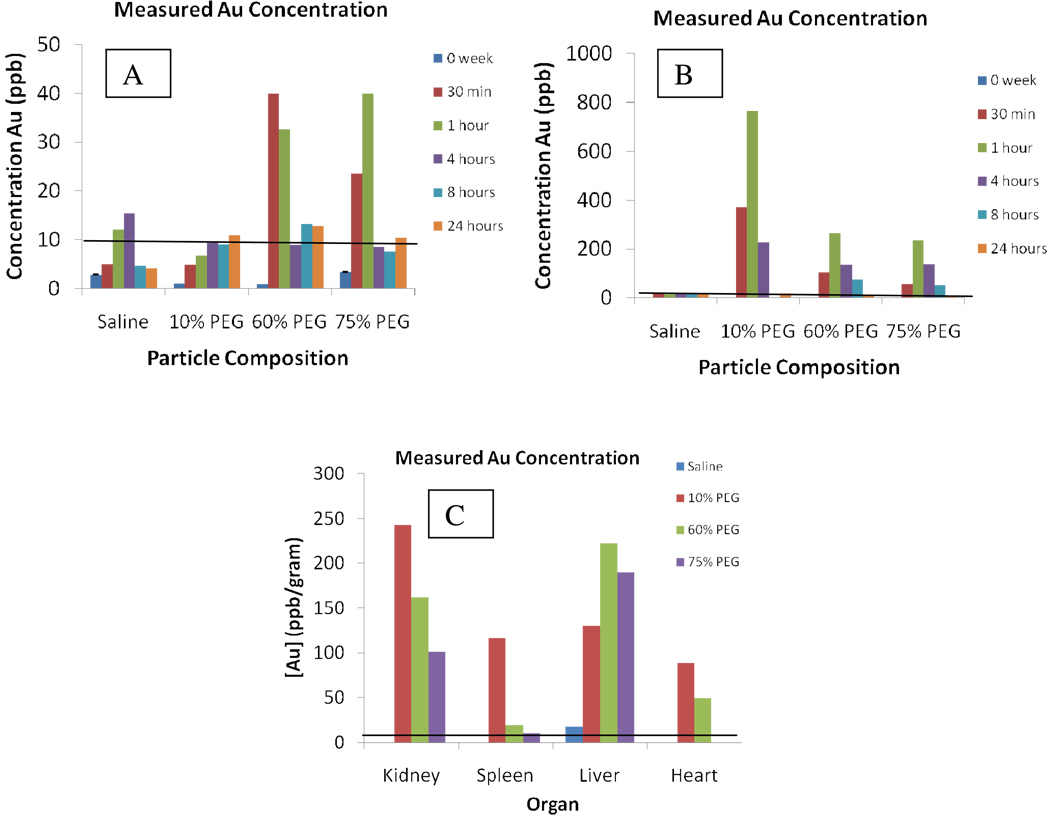
Figure 1.
ICP-OES gold analysis for a) blood, b) urine and c) organs of PEG4-acid injected mice 4 weeks post-injection. A 5 µL sample was diluted in 10 mL of nitric acid/aqua regia solution (total dilution factor = 2000). Low concentrations of gold were noted in the bloodstream while high concentrations were seen in the urine. No gold was observed at the 2 and 4 week time periods. Clearance profiles for the 10% group mimicked those previously seen for TMPCs. Gold analysis of the organs showed decreasing correlation of organ residence with increase in PEG percentage for both kidney and spleen. Black line signifies the detection limit of the ICP-OES at 10 ppb Au.

