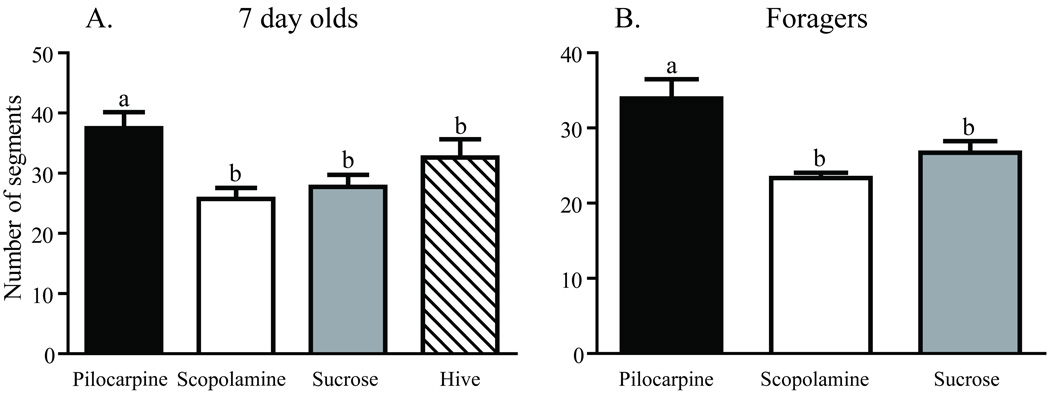
Fig. 4.
Total number of dendritic segments of collar Kenyon cells from age- and experience-matched honey bees. A, Comparison of seven-day-old honey bees after one week of chronic treatment. B, Comparison of one-week foragers after 5 days of chronic treatment. Sample sizes for each group are listed in Table 1. Statistical analysis of these data used a one-way ANOVA model. Groups assigned the same letter are not different (Newman-Keuls post hoc tests).

