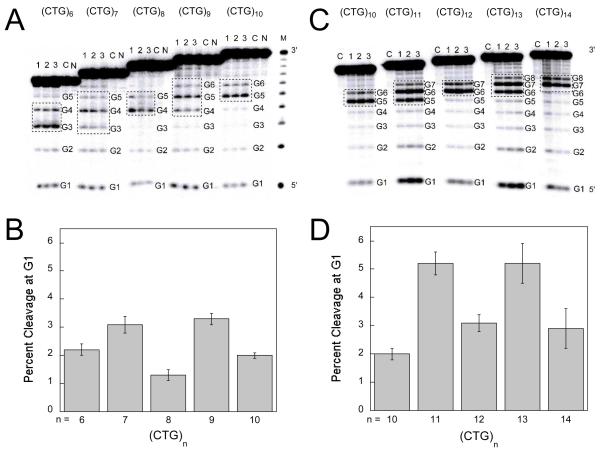
Figure 4.
(A) Autoradiogram showing DEPC chemical probe reactivity profiles of (CTG)6 through (CTG)10. Each group contains two control lanes (N is DNA only and C is DNA treated with piperidine) and three replicates (lanes 1, 2, and 3) corresponding to reaction of the DNA with DEPC and piperidine. Conditions were 5 μM DNA in 20 mM sodium phosphate, 10 mM NaCl, pH 7.0. (B) Percent cleavage at G1 for (CTG)6-10. Error represents the standard deviation obtained for the three replicates. (C) Autoradiogram showing DEPC chemical probe reactivity profiles of (CTG)10 through (CTG)14. Each group contains one control lane C which is piperidine-treated DNA and three replicates (lanes 1, 2, and 3) corresponding to reaction with DEPC and piperidine. (D) Percent cleavage at G1 for (CTG)10-14. Error represents the standard deviation obtained for the three replicates.

