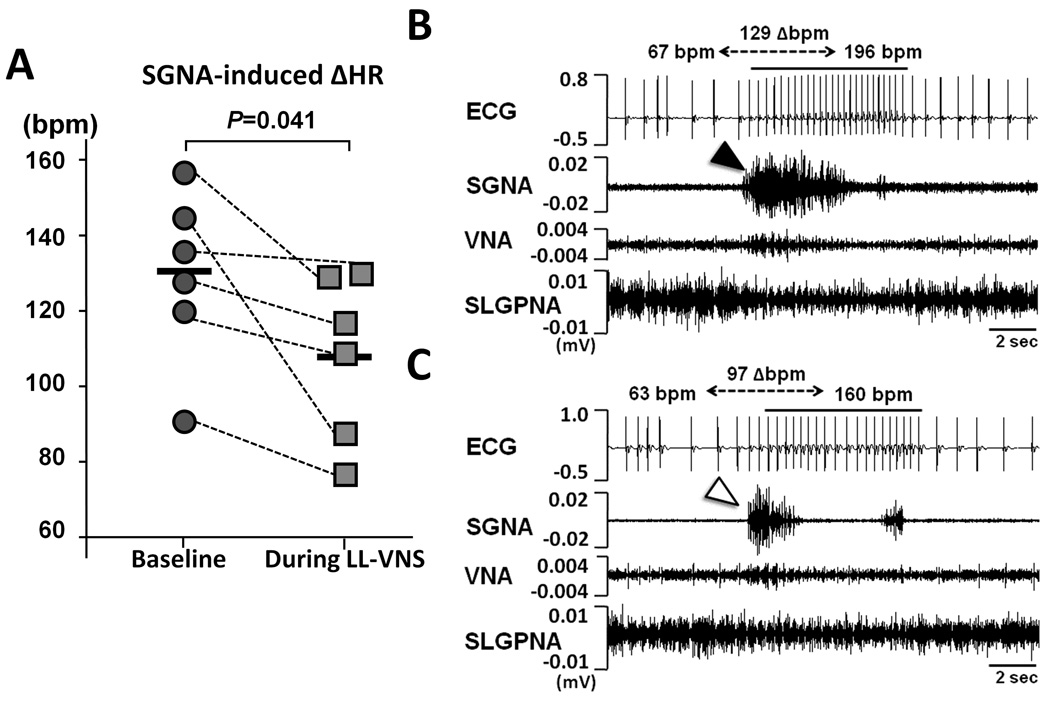
Figure 4.
Effects of LL-VNS on SGNA-induced heart rate changes. A, Graph of statistical dot plot shows that the SGNA-induced heart rate acceleration was markedly attenuated during LL-VNS compared to baseline. B, An example at baseline shows a burst of SGNA (black arrowhead) led to heart rate increase from 67 to 196 bpm (129 bpm increment). C, An example during LL-VNS shows a burst of SGNA (white arrowhead) led to heart rate increase from 63 to 160 bpm (97 bpm increment).

