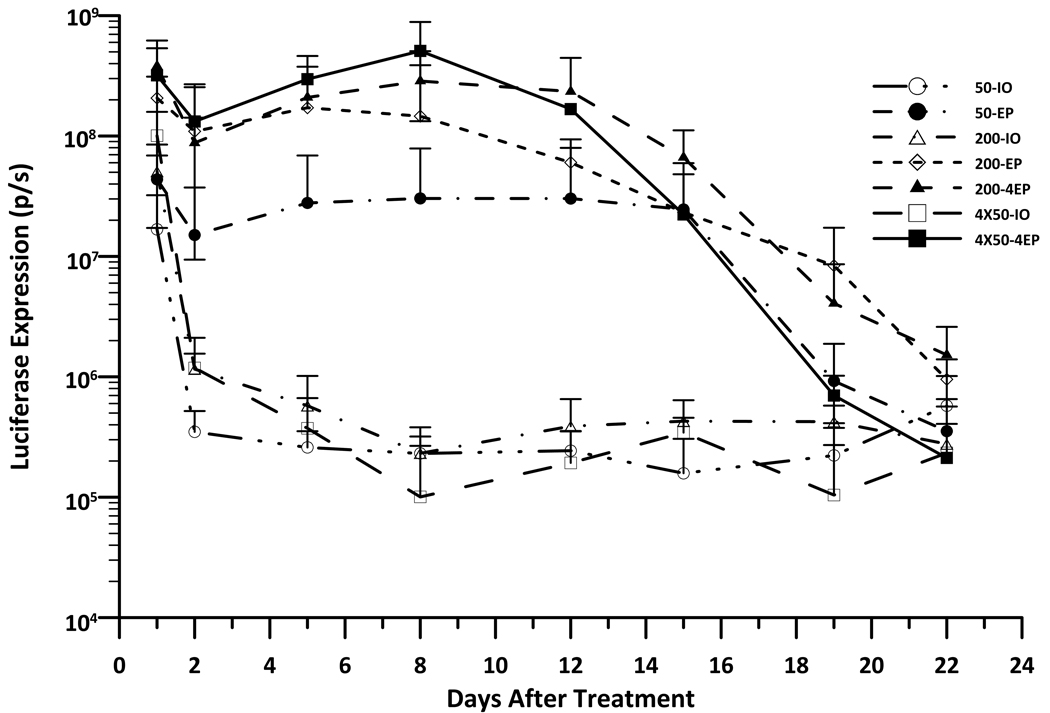
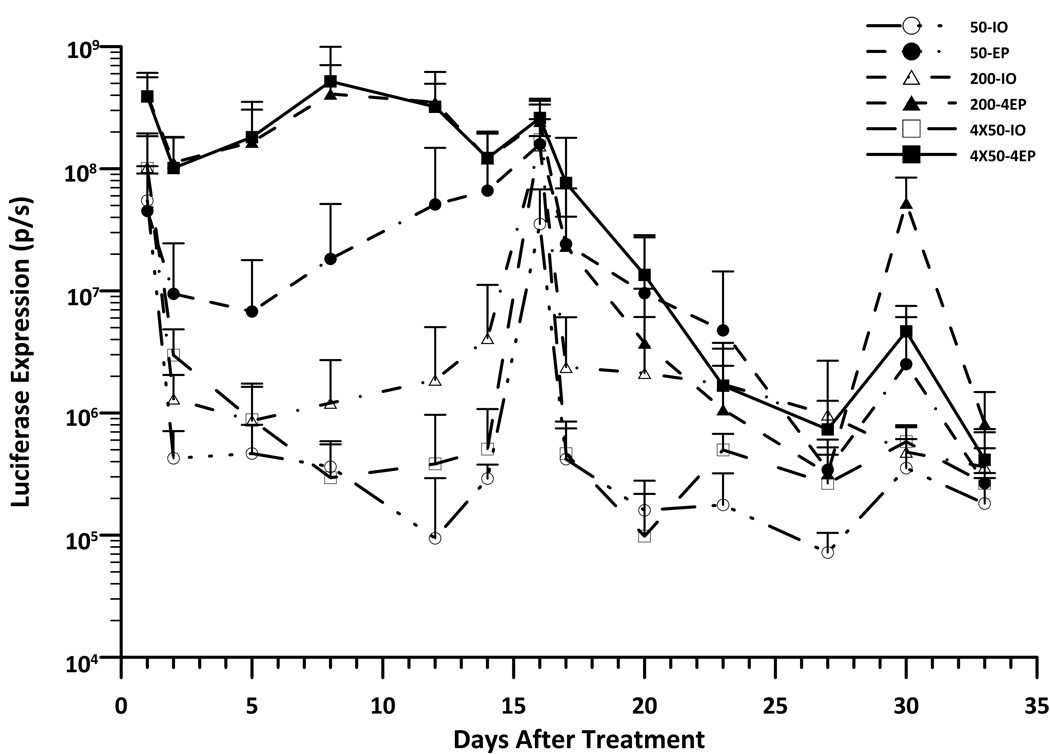
Figure 1. Kinetic of gene expression in skin after i.d. DNA (gWiz-Luciferase) injection and non-invasive EP.
Delivery groups, 50µL-IO: 50µL DNA without EP; 50µL-1EP: 50µL DNA with 1 EP on the injection site; 200µL-IO: 200µL DNA without EP; 200µL-1EP: 200µL DNA and 1 EP; 200µL-4EP: 200µL DNA and 4 EPs; 50µLx4-IO: 4 injections with 50µL DNA without EP; 50µLx4-4EP: 4 injections with 50µL DNA and each EP on the injection site. A, Time course of luciferase expression in guinea pig skin after 1 time delivery at d0. Bars represent mean ± SD. 4–5 sites were analyzed for each delivery. B, Time course of luciferase expression in guinea pig skin with 3 time deliverys, separately at d0, d15 and d29. Bars represent mean ± SD. 5–6 sites were analyzed for each delivery. p/s = photons/second.


