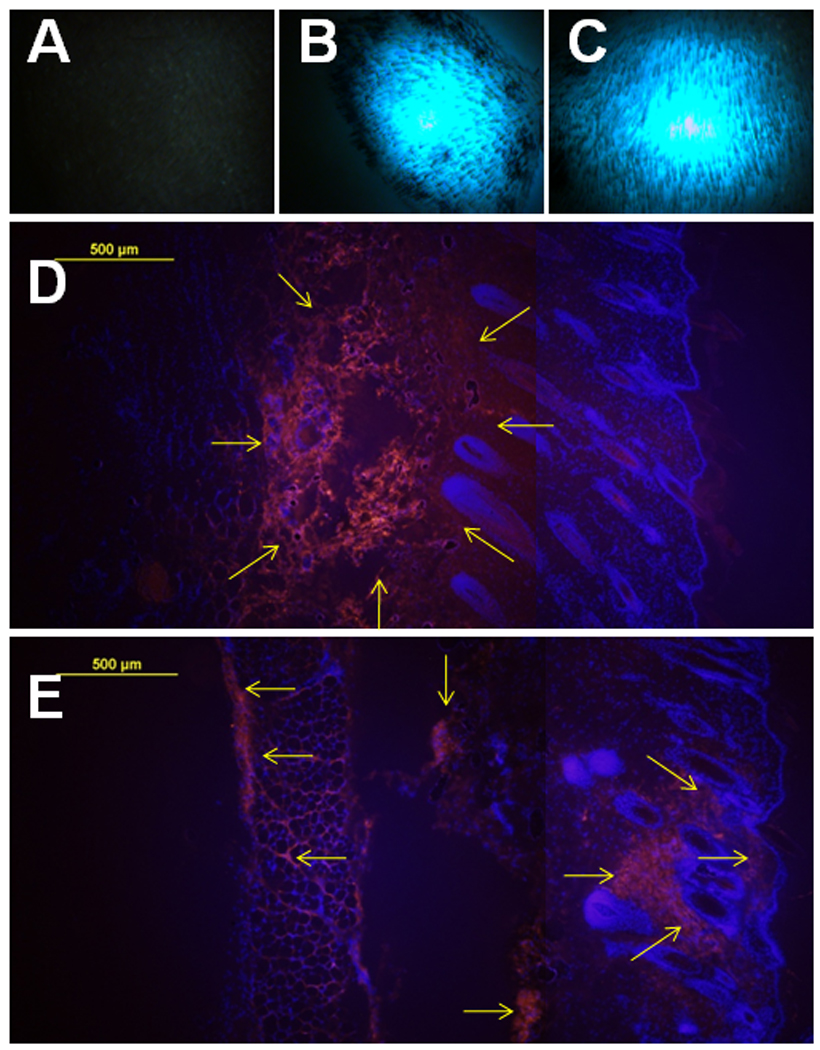
Figure 4. DNA distribution in the skin after i.d. DNA injection and non-invasive EP.

A, B, C, Skin observation by flurorescence stereoscope after delivery with Fluorescein-labeled plasmid. Pictures were taken at post-delivery 1 hour. One representative picture of 2 sites was shown here. Delivery group: A, control; B, 50µL-IO: 50µL DNA without EP; C, 50µL-1EP: 50µL DNA with 1 EP on the injection site. D, E, total 4 cryosections (2 sections per sample) of each delivery were analyzed. Cell nuclei were blue-stained by DAPI. Cy™3-labeled DNA was shown red as indicated by arrows. D, One representative section of 50µL-IO was presented. E, One representative section of 50µL-EP was presented (magnification = 100, scale bar=100µm).
