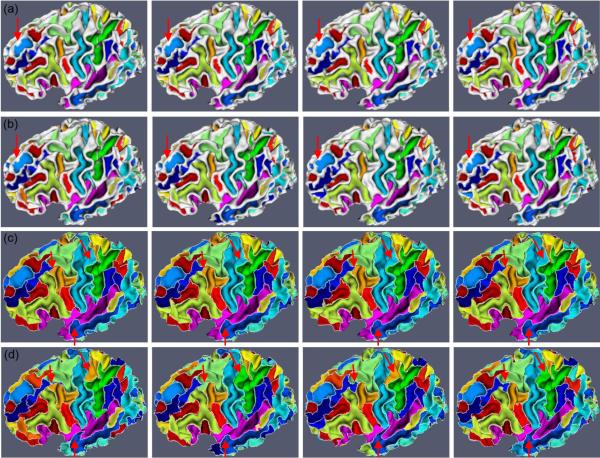
Figure 4.
An example of sulcal parcellation results on longitudinal cortical surfaces of a subject with 4 successive time points. Figures (a) and (b) show the sulcal region segmentation results by our proposed method and the flow tracking method (Li et al., 2009), respectively. Figures (c) and (d) show the corresponding sulcal basin parcellation results by our proposed method and the flow tracking method (Li et al., 2009), respectively. White curves in Figures (c) and (d) indicate the boundaries of parcellated sulcal basins. Red arrows indicate the selected locations where our results are much more consistent than those by the flow tracking method.

