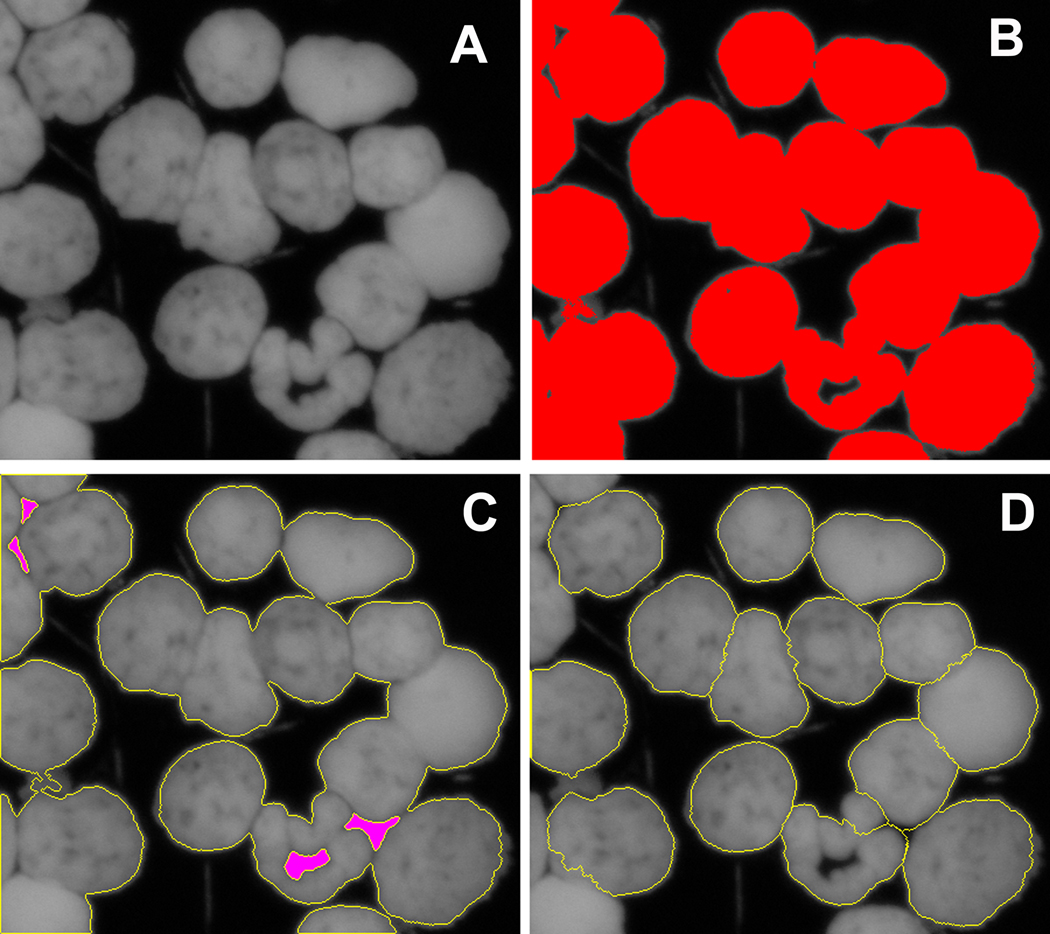
Figure 2.
Identification of nuclei in the complex image using object splitting procedure. Panel A shows a fragment of the fluorescent image (DAPI channel, represented as a gray scale image) obtained from a mouse jejunum touch-print. Panel B demonstrates the result of intensity threshold segmentation applied to that image. The segmented area is shown in red colour. Individual nuclei overlap and can not be separated by the intensity threshold segmentation. The outline of the nuclear area is shown in yellow colour in panel C. Pink areas indicate areas below threshold within segmented (nuclear) area. Panel D demonstrates how individual nuclei are automatically separated using our object splitting algorithm. Outlines of individual nuclei are shown in yellow colour.

