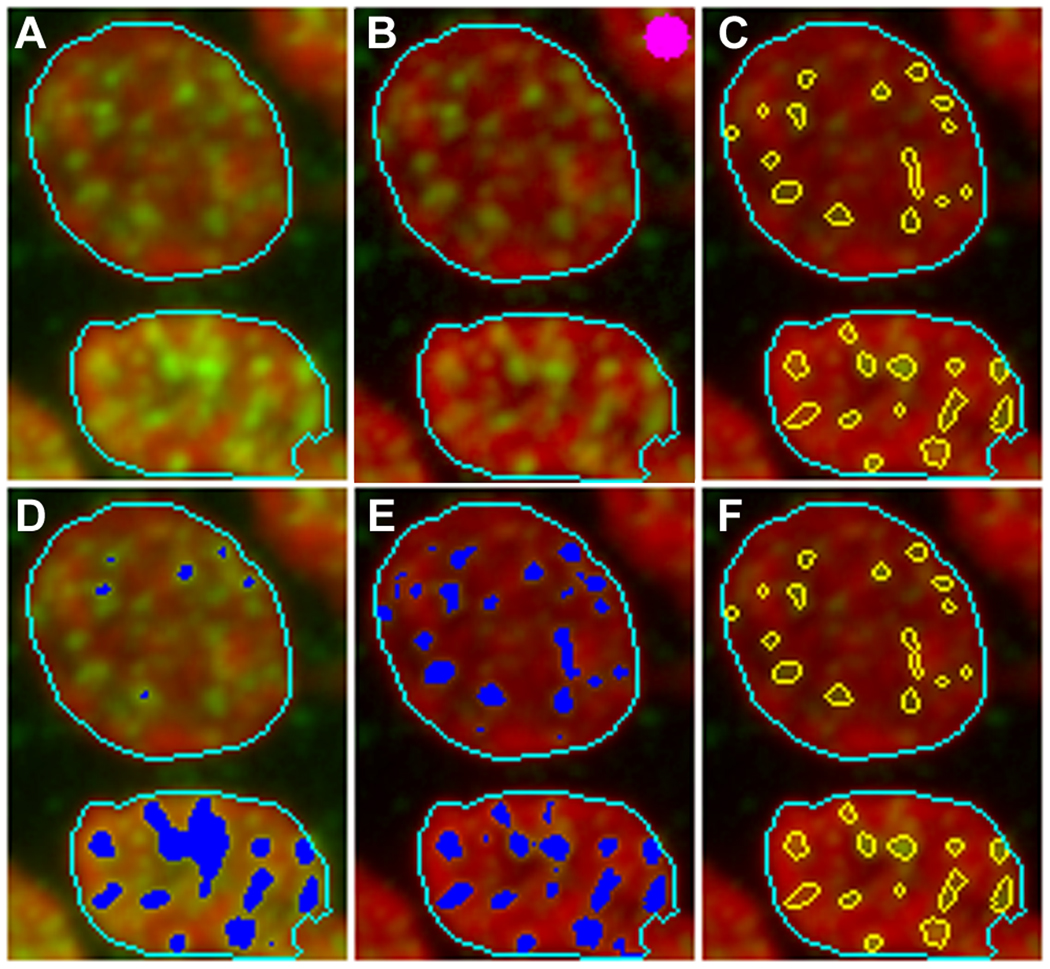
Figure 3.

Illustration of the image analysis and focus identification algorithm. Panel A shows a fragment of an image of mouse tongue section with two nucleus object outlined in light blue colour. Panel D shows the segmentation of the image using the conventional intensity threshold. Application of the Top Hat transformation and subsequent segmentation using H-Dome transformation in combination with the intensity threshold are demonstrated in panels B and E respectively. The structuring element is shown in panel B (top left corner) in pink colour. Panel C illustrates identification of foci, and subsequent application of the object splitting procedure is shown in panel F.
