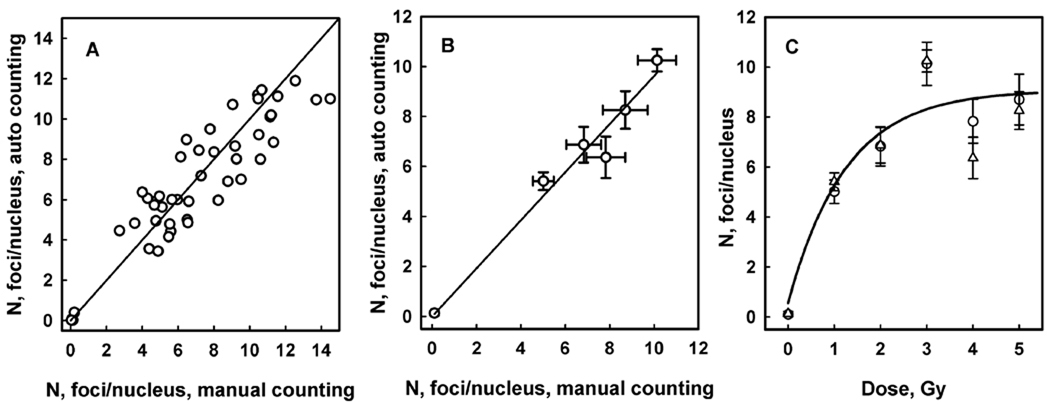
Figure 6.
Focus counting analysis in mouse jejunum cells. Mice were irradiated with doses 1, 2, 3, 4 and 5 Gy (3 mice for each dose). Panel A: each data point represents average number of foci per nucleus calculated for an individual fluorescence image. The number of nuclei identified in each image varies from 50 to 160. The total number of images analysed is 47. The line is drawn with the intercept = 0 and the slope = 1. The correlation coefficient R2 = 0.799 (P<0.0001). Panel B: each data point represents average number of foci per nucleus calculated in a range of fluorescence images obtained from mouse jejunum touch-prints irradiated at a given dose. Error bars indicate the standard error. The line is generated as a result of linear regression analysis. Two-parameter linear regression analysis resulted in the following values: slope = 0.946 ± 0.090, intercept = 0.125 ± 0.647. Given that the intercept is not different significantly from 0, subsequent single-parameter linear regression resulted in the following value: slope = 0.962 ± 0.036. The correlation coefficient R2 = 0.965 (P<0.0005). Panel C: dose response of γ-H2AX foci induction in mouse intestine cells 1 hr after irradiation. Symbols represent results of manual (circles) and automatic (squares) counting. The line is drawn as a result of non-linear regression analysis of combined (manual and automatic) results using the three-parameter saturation model described by the expression: , where D is the radiation dose, N0 is the number of foci in non-irradiated cells, Nm is the saturation level, δ [Gy−1] is the focus yield per unit of radiation dose (initial slope of the response curve). The yield of foci δ = 7.5 ± 3.8 Gy−1, the saturation level Nm = 8.06 ± 0.43.

