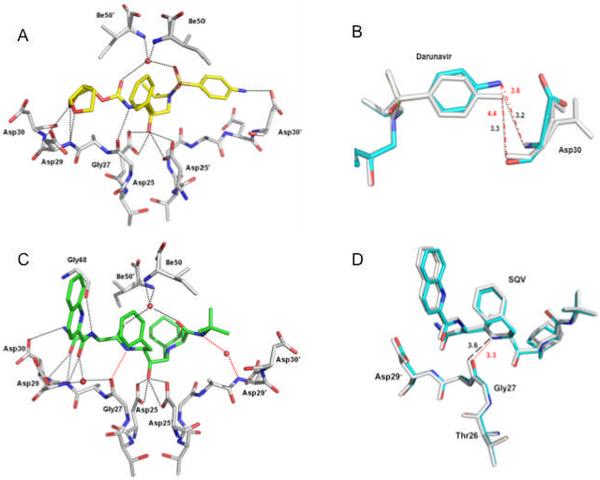
Figure 6.
Protease-inhibitor hydrogen bond interactions. Hydrogen bonds are indicated by dotted lines. Water molecules are represented as red spheres. A. PRL76V hydrogen bond interactions with the major conformation of DRV (in yellow). B. Superposition of PRL76V-DRV (cyan bonds) and PR-DRV (grey bonds) showing PRL76V has fewer hydrogen bond interactions with the aniline group of DRV. The side chain of Asp30 has two alternate conformations in the PR-DRV structure. Interatomic distances are shown in Å with black dotted lines indicating the hydrogen bond interactions in the wild type complex, and red broken lines show the larger interatomic separation in the mutant. C. PRL76V hydrogen bond interactions with the major conformation of SQV (in green). The red dotted lines indicate the new hydrogen bond interactions formed by SQV in PRL76V relative to PR-SQV. D. Superposition of PRL76V-SQV (cyan bonds) and PR-SQV (grey bonds) showing the improved interaction of SQV with PRL76V arising from only slight structural changes. Red dotted lines indicate the new hydrogen bond interaction in the mutant, and black broken lines show the larger interatomic separation in the wild type SQV complex.

