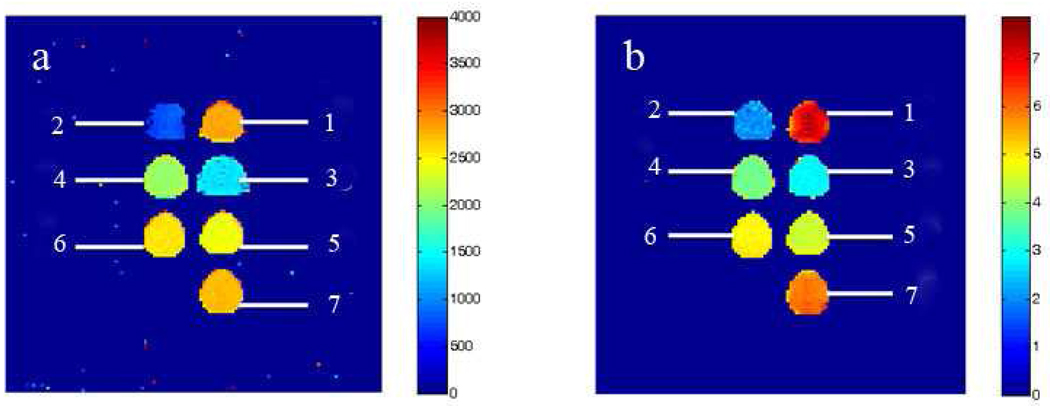
Figure 2.
(a) Longitudinal T1 and (b) T2 map images of the 18.6 nm cubic iron oxide NPs coated with HOOC-PEG-PL and dispersed in Milli-Q water. Scale bar in (a) is linear (unit: milliseconds), while in (b) it is in logarithmic units. Sample concentrations are (1): 0 mM Fe (pure Milli-Q water), (2): 0.93 mM Fe, (3): 0. 37 mM Fe, (4): 0.14 mM Fe, (5): 0.06 mM Fe, (6): 0.04 mM Fe, and (7): 0.01 mM Fe.

