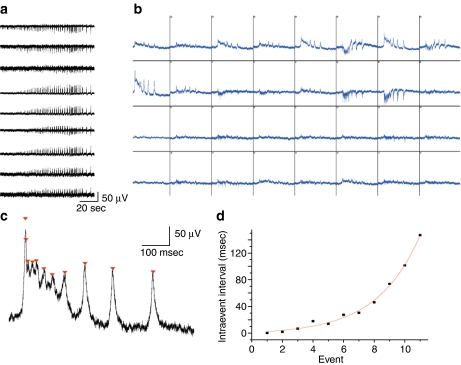
Fig. 2.
Multi-electrode array (MEA) recordings reveal complex distribution of activity patterns across electrodes. a Representative example of 9 MEA channels (out of 32 channels total) recorded simultaneously show spatio-temporal evolution of the network dynamics upon application of high (10 mM) KCl. b Example of a single synchronized network event occurring at the steady-state phase of the oscillations. All 32 channels are shown (display resolution 1 s/500  V) on a short time scale. Channels are numbered successively from the upper left to the lower right. c Close up of single event channel 9 from b, notice exponential increase in the length of intraevent peak intervals, closed triangles cap each intraevent peak. d Single exponential fit of the intraevent intervals from c


