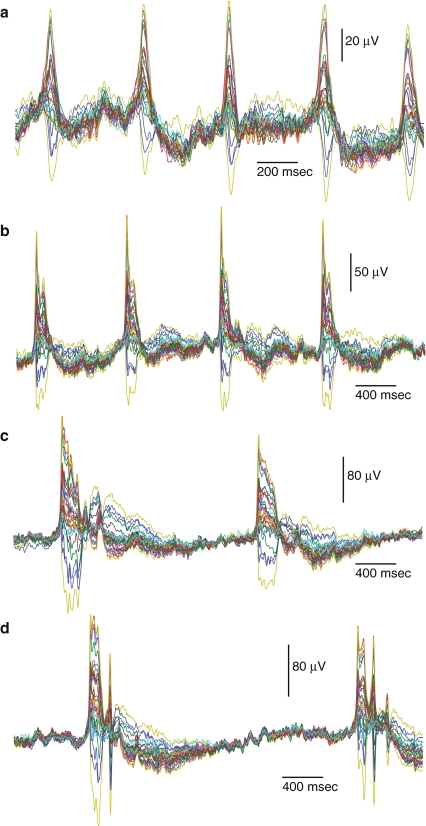
Fig. 4.
Waveform distributions of data in multi-channel recordings for selected typical burst events from recordings shown in Fig. 1a. a High-frequency bursting at the beginning of epileptiform development (see Fig. 1d). b High-amplitude bursts at the end of the initial phase of epileptiform development. c Low frequency bursting near the peak at the maximum activity of the oscillations (see Fig. 1e). Note different voltage scale. d Long multi-peak burst events at the end of the run corresponding to Fig. 1f

