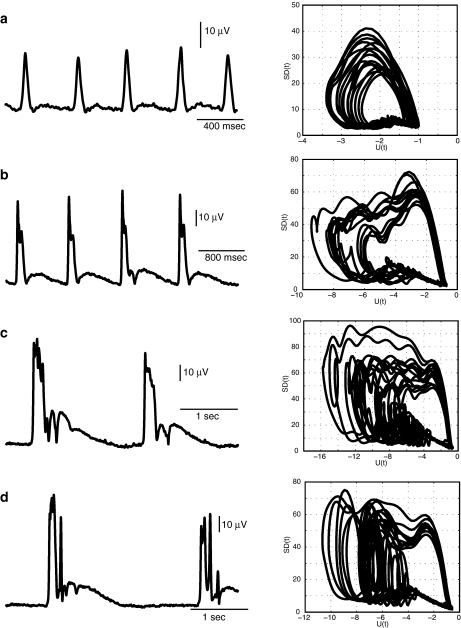
Fig. 5.
Characteristic state attractors during different epochs of epileptiform activity. Waveforms of standard deviation SD(t) computed for data sets shown in Fig. 4 (left panels) and attractors plotted as a projection on variable plane (SD(t), U(t)) for each type of oscillations (right panels)

