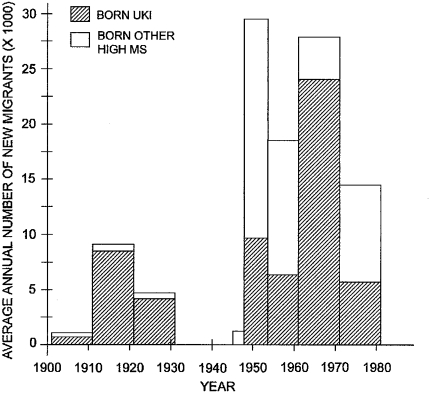
Fig. 2.
Average annual number of new immigrants born in MS high risk countries who entered Australia between each census. Numbers (1,000×) indicated by hatched columns for UKI and by open columns above the UKI for the other high risk countries. Data in Table 1

