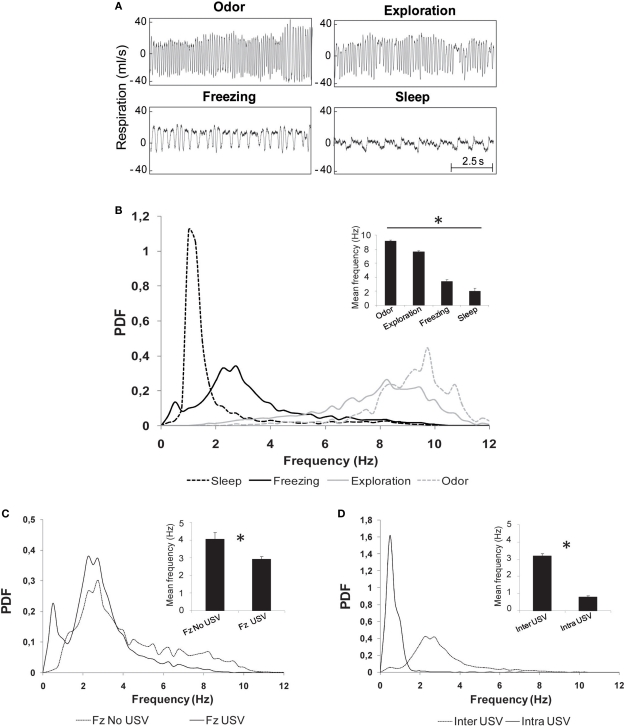
Figure 4.
Evolution of respiratory frequency with behavior. (A) Individual examples of respiratory traces observed during four stable behavioral states: odor sampling, exploration, freezing, and sleep. (B) Distribution of respiratory frequencies (probability distribution function: PDF) in the different behavioral states. The distributions were obtained with a 0.25 Hz bin. Insert: mean ± SEM frequency for each behavior. *Significant differences between all the mean values 2 by 2 (p < 0.001). (C) Distribution of respiratory frequencies during freezing in two subgroups: animals emitting USV (Fz USV) and animals emitting no USV (Fz no USV). Insert: mean ± SEM frequency for each subgroup. *Significant differences between the two values (p < 0.01). (D) Distribution of respiratory frequencies during call emission (intra-USV) or between calls (inter-USV). Insert: mean ± SEM frequency for each period. *Significant differences between the two values (p = 0.0005).

