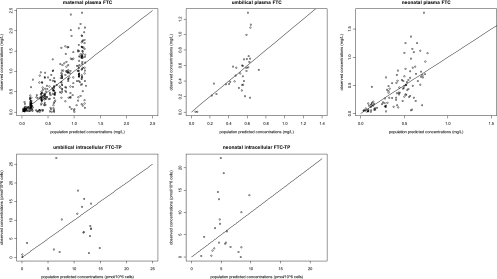
Fig. 3.
Observed versus population-predicted concentrations for maternal plasma FTC (top left panel), for cord plasma FTC (top middle panel) and cord PBMC FTC-TP (bottom left panel), for neonatal plasma FTC (top right panel), and for neonatal PBMC FTC-TP (bottom middle panel). The solid line represents the identity line.

