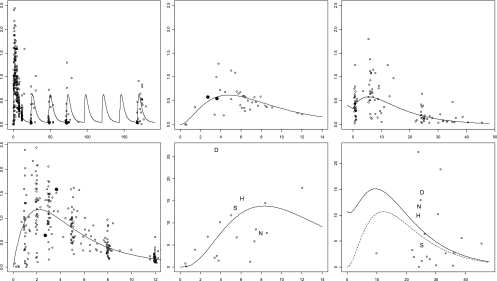
Fig. 4.
Observed (symbols and letters) and population-predicted (line) concentrations versus time for maternal plasma FTC (all treatment long, top left; during the first 12 h, bottom left), for cord plasma FTC (top middle), and cord PBMC FTC-TP (bottom middle), for neonatal plasma FTC (top right) and for neonatal PBMC FTC-TP (bottom right). The dashed line represents the FTC-TP profile resulting only from neonatal administration. Solid symbols represent the 2 mother-fetus pairs for which the mother was readministered FTC because she delivered more than 12 h after the first intake. In the FTC-TP graph, concentrations in children with serious adverse events are represented by letters: D for death, H for hyperbilirubinemia, N for neutropenia, and S for serious brain injury.

