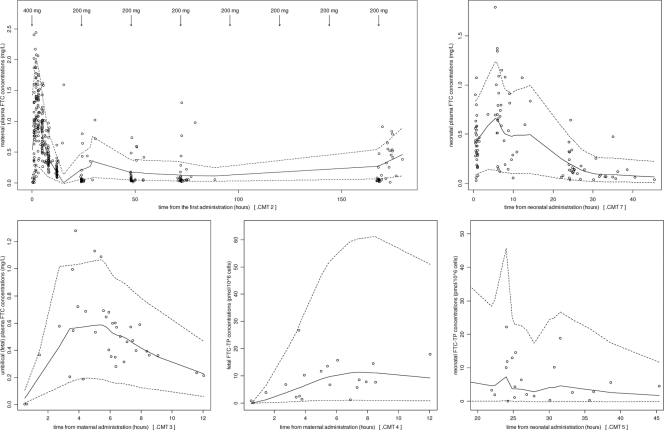
Fig. 5.
Evaluation of the final model: comparison between the 5th (dashed line), 50th (full line) and 95th (dashed line) percentiles obtained from 1,000 simulations and the observed data (points) for plasma FTC concentrations in mother (top left panel), in cord (bottom left panel), and in neonates (top right panel) and for intracellular concentrations in PBMC FTC-TP in the fetus (bottom middle panel) and FTC-TP in the neonate (bottom right panel).

