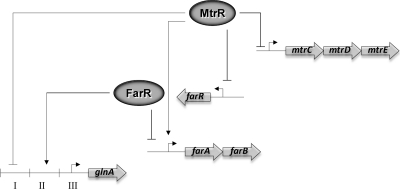
Fig. 6.
Model of glnA regulation by MtrR and FarR. Direct repression and activation of genes is shown by the solid-barred and arrowed lines, respectively, while indirect activation (i.e., MtrR activation of farAB) is show by the dashed, arrowed line. The binding of proteins is shown adjacent to promoter regions (bent arrow). With respect to glnA, the binding of MtrR is shown within section I and the binding of FarR is shown within section II of the DNA sequence shown in Fig. 1. The ability of MtrR to repress glnA is proposed to be due to its capacity to repress farR expression (15) and its ability to diminish FarR binding within section II (Fig. 5).

